Who are the top 100 countries by GDP?
The United States is the world’s biggest economy, at about $32.4 trillion in 2026 or about a quarter of the world’s GDP, followed by China at $20.9 trillion and Germany at $5.5 trillion; here are the top 100, from the United States to Cambodia.

Here's the answer from Mary's digital twin. The gray check mark turns green once Mary has confirmed it.
These are the IMF’s April 2026 forecasts of each economy’s size in 2026, in US dollars at market exchange rates. The whole world economy comes to about $126 trillion, and the top 10 alone make up about two-thirds of it.
The top 100
Services, technology, finance and consumer spending in the world’s largest consumer market.
Manufacturing, exports, infrastructure investment and a fast-growing technology and consumer sector.
Export-oriented manufacturing, especially cars, machinery, chemicals and electrical equipment.
Advanced manufacturing of cars, electronics and machinery, plus a large services sector.
Financial and professional services centered on London, plus pharmaceuticals and aerospace.
Services, especially IT and business outsourcing, plus agriculture and growing manufacturing.
Services, tourism, aerospace, luxury goods, agriculture and nuclear-powered electricity.
Manufacturing of machinery, vehicles, fashion and food, plus tourism and services.
Oil, natural gas and metals, which dominate its exports and government revenue.
Agribusiness such as soybeans, beef and coffee, plus iron ore, oil and services.
Services, oil and gas, mining, forestry and trade closely tied to the United States.
Mining exports such as iron ore, coal and gas, plus services and education.
Manufacturing exports to the United States, especially cars and electronics, plus oil and remittances.
Tourism, services, car manufacturing, agriculture and renewable energy.
Exports of semiconductors, electronics, cars, ships and petrochemicals from large industrial groups.
Manufacturing, textiles, cars, construction, agriculture and tourism bridging Europe and Asia.
Domestic consumption, coal, palm oil, nickel and other natural resource exports.
Trade and logistics through Rotterdam, chemicals, agriculture exports and semiconductor equipment.
Oil, which makes up most of its exports and government income.
Banking and finance, pharmaceuticals, precision machinery, watches and commodity trading.
Manufacturing, services and exports integrated into European Union supply chains.
Semiconductor manufacturing and electronics exports, led by the world’s largest contract chipmaker.
Multinational technology and pharmaceutical firms attracted by low corporate taxes.
Services, chemicals, pharmaceuticals and trade through the port of Antwerp.
Advanced manufacturing, telecom equipment, vehicles, forestry and technology services.
High-tech industries including software, cybersecurity, chips and defense technology.
Agriculture exports such as soybeans, corn and beef, plus shale energy and services.
Global finance, shipping and trade hub, plus electronics and petrochemical manufacturing.
Manufacturing, machinery, tourism and services tied closely to the German economy.
Oil and gas, plus trade, aviation, tourism, real estate and finance centered on Dubai.
Offshore oil and gas, seafood and shipping, backed by a huge sovereign wealth fund.

Tourism, car and electronics manufacturing, and agricultural exports such as rice and rubber.
Oil, coal, coffee and flowers exports, plus services and domestic consumption.
Export manufacturing of electronics, phones, clothing and footwear for global brands.
Electronics and semiconductor manufacturing, palm oil, and oil and gas exports.
Services, business process outsourcing, and remittances from overseas workers.
Garment manufacturing exports, remittances from workers abroad, and agriculture.
Pharmaceuticals, shipping, wind energy and agricultural exports such as pork and dairy.
Manufacturing, car production, IT services and agriculture within the European Union.
Mining of platinum, gold and coal, plus finance, manufacturing and services.
International finance, trade and logistics serving as a gateway to mainland China.
Car and machinery manufacturing closely integrated with German industry.
Suez Canal revenue, tourism, natural gas, remittances and agriculture.
Copper mining, the world’s largest supply, plus lithium, fruit and salmon exports.
Agriculture, textiles, services and remittances from workers abroad.
Mining of copper, gold and zinc, plus agriculture and fisheries exports.
Tourism, services, manufacturing and exports within the European Union.
Oil exports for most government revenue, plus agriculture, trade and services.
Oil, gas, uranium and metals mining, which dominate its exports.

Forestry, paper, telecom technology, machinery and metals industries.
Oil and natural gas, which make up most of its exports and state revenue.
Tourism, shipping and services, plus agriculture such as olive oil.
Oil and gas, petrochemicals and agriculture, constrained by international sanctions.
Agricultural exports such as dairy, meat and wool, plus tourism and services.
Car and electronics manufacturing for export within European Union supply chains.
Oil, which makes up nearly all of its exports and government income.
Agriculture such as grain and sunflower oil, metals, and IT services amid war.
Liquefied natural gas exports, among the largest in the world, plus oil.
Phosphate mining, agriculture, tourism, car manufacturing and remittances from Moroccans abroad.
Natural gas, gold, cotton and remittances from workers in Russia.
Oil, which makes up most of its exports and government income.
Car manufacturing, the highest per capita in the world, plus electronics.
Oil, which makes up the bulk of its exports, plus diamonds.
Manufacturing, IT services, agriculture and tourism within the European Union.
Agriculture such as tea and flowers, tourism, and mobile financial services.
Oil, bananas, shrimp and flowers exports, using the US dollar as currency.
Tourism, manufacturing in free trade zones, remittances from abroad, and gold mining.
Pharmaceutical and medical device manufacturing, plus services and tourism.
Remittances, agriculture such as coffee, sugar and bananas, and textiles.
Mining of copper and cobalt, the world’s largest cobalt supplier.
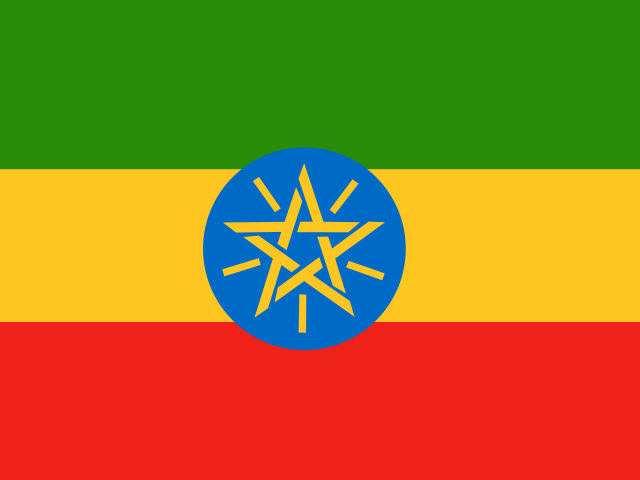
Agriculture, especially coffee, plus infrastructure investment and services.
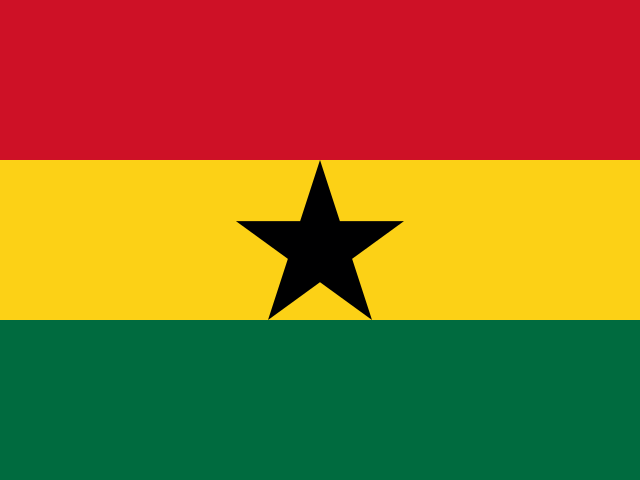
Gold, cocoa and oil exports, plus services and agriculture.
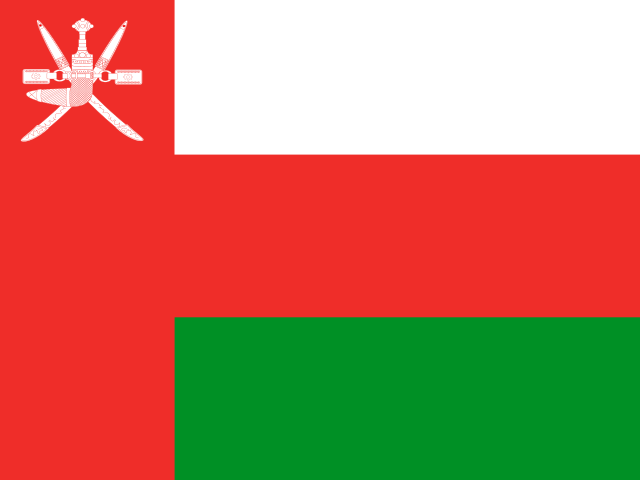
Oil and gas, which dominate exports and government revenue.
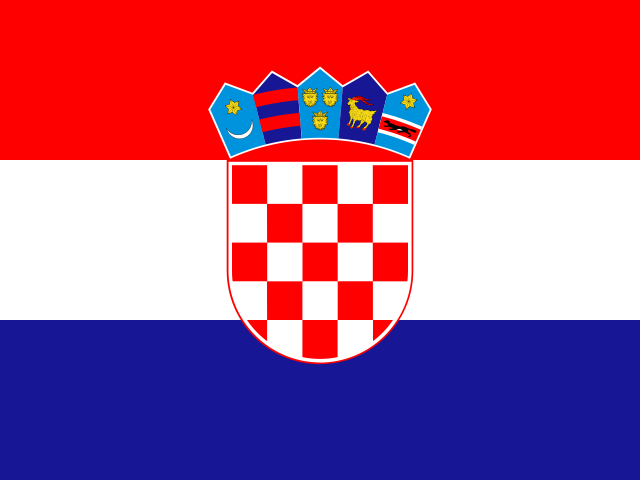
Tourism along the Adriatic coast, plus services and manufacturing.
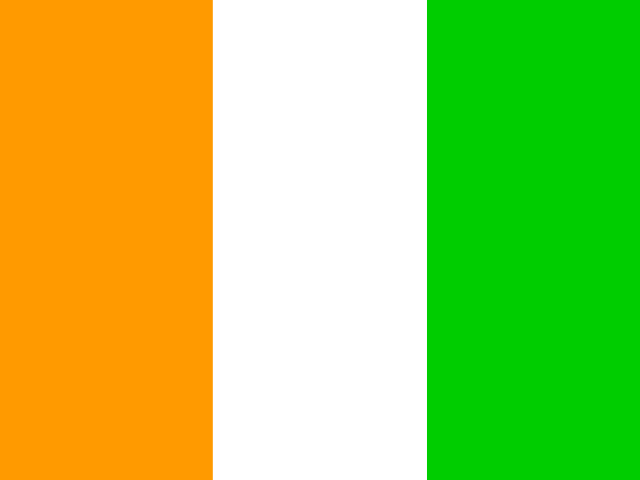
Cocoa, the world’s largest producer, plus coffee, cashews and oil.
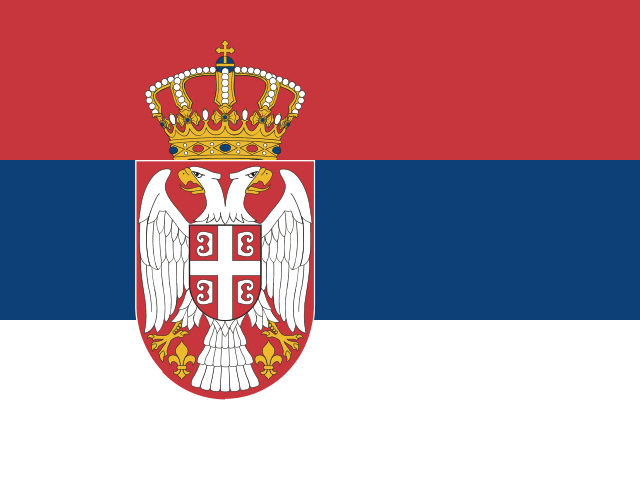
Manufacturing, agriculture, IT services and foreign investment in industry.
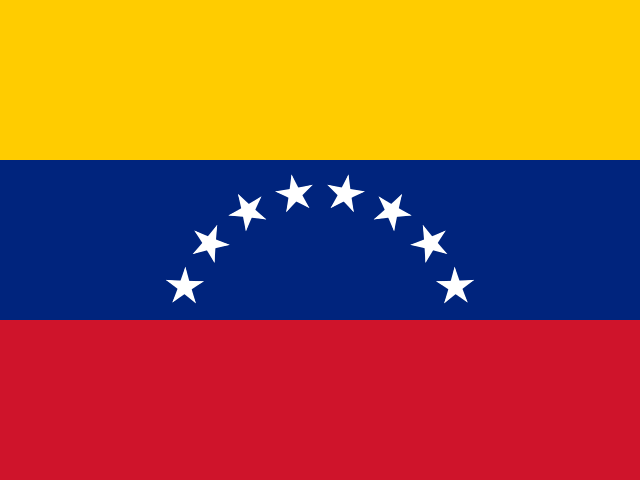
Oil, which holds the world’s largest proven reserves and dominates exports.
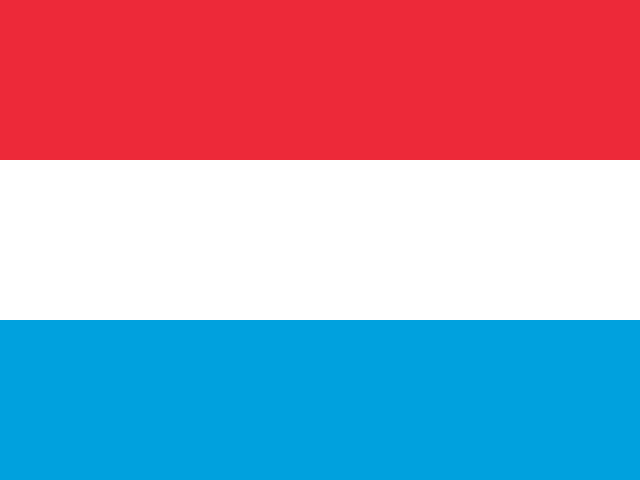
Financial services, investment funds and banking, plus steel and logistics.
Medical device exports, tourism, services and agriculture such as bananas and pineapples.

Manufacturing, logistics, agriculture and fintech services within the European Union.
Manufacturing, potash fertilizer and refined oil products, closely tied to Russia.
Tea, clothing exports, tourism and remittances from workers abroad.
Agricultural exports such as beef, soybeans and pulp, plus services.
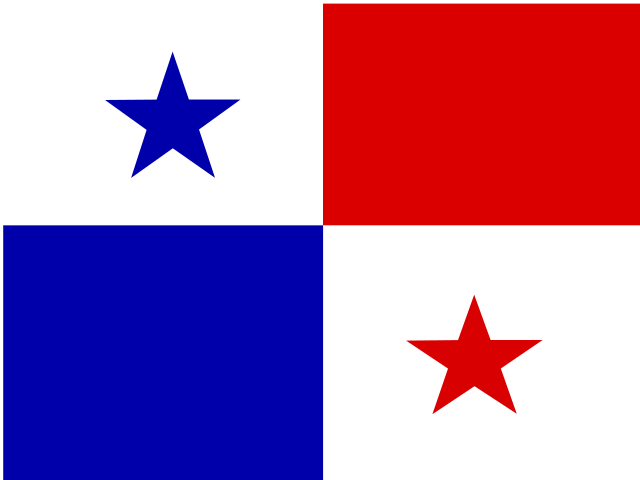
Panama Canal revenue, plus logistics, banking and other services built around trade.
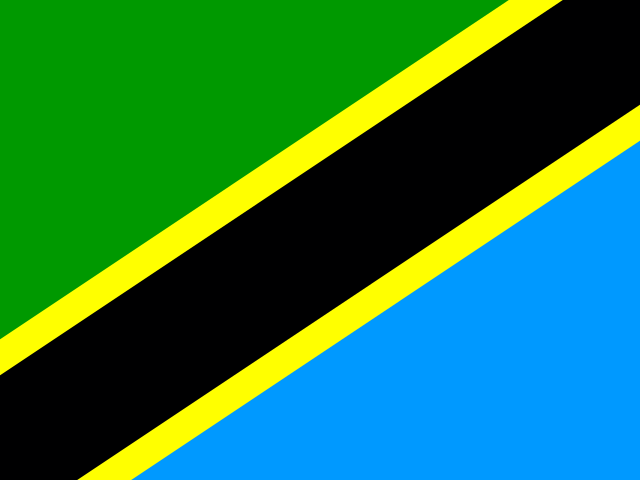
Agriculture, gold mining and tourism centered on safaris and Zanzibar.
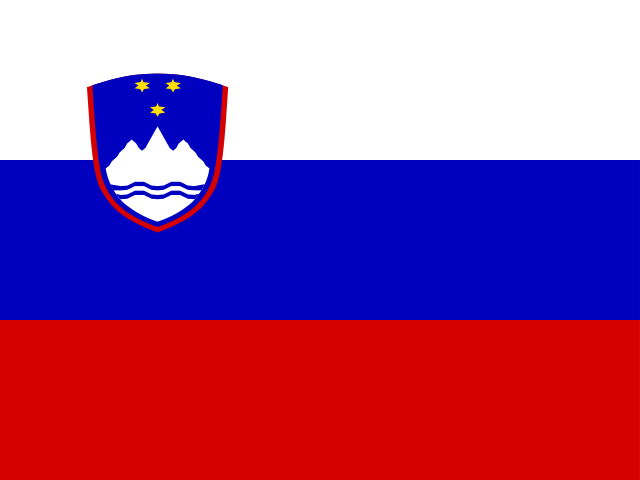
Manufacturing of cars, pharmaceuticals and electrical equipment for export.
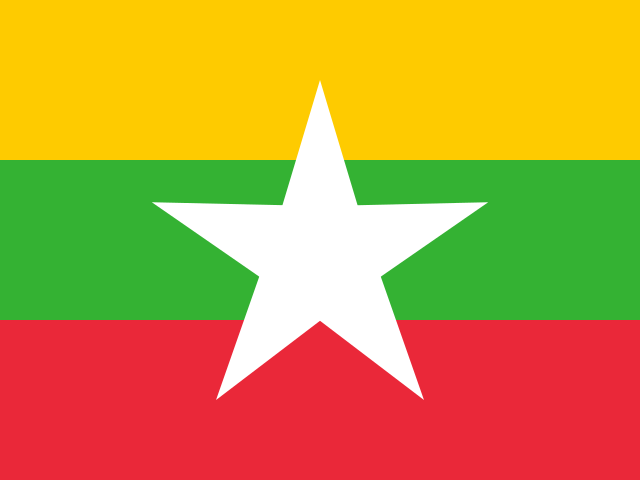
Agriculture, natural gas, jade and garment exports amid civil conflict.
Natural gas, among the world’s largest reserves, mainly exported to China.
Natural gas, minerals such as zinc and silver, and agriculture.
Oil and gas from the Caspian Sea, which dominate its exports.
Agriculture, especially coffee, plus gold exports and services.
Oil, timber, cocoa and coffee exports, plus agriculture.
Services, tourism, phosphate and potash mining, and remittances.
Manufacturing for Europe, tourism, phosphates and olive oil exports.
Soybean and beef exports, plus hydroelectric power sold to Brazil and Argentina.
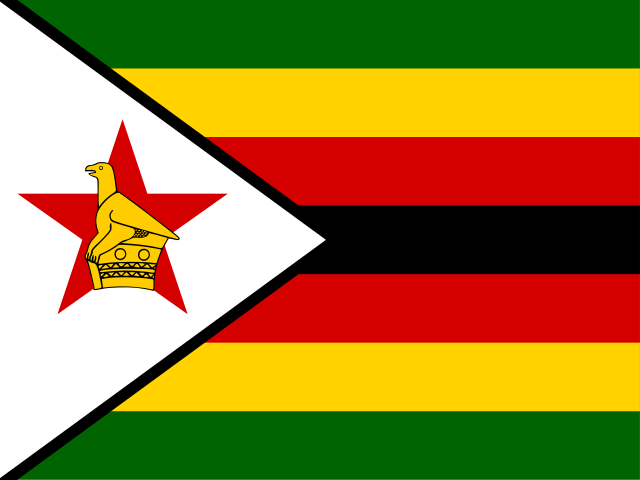
Mining of gold, platinum and lithium, plus tobacco and agriculture.
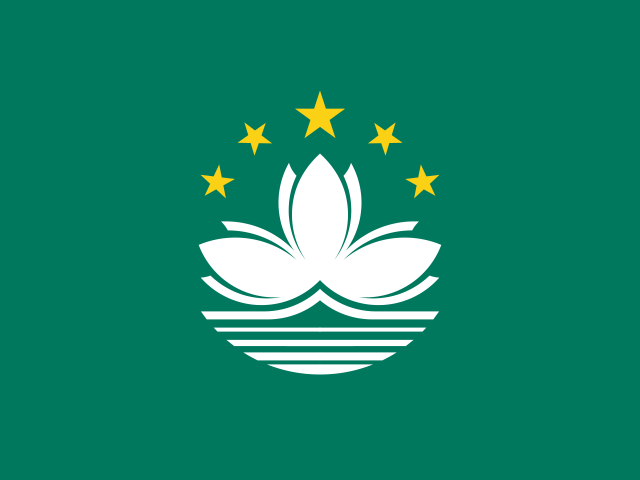
Casino gaming and tourism, the world’s largest gambling hub.

Services, logistics, timber and wood products within the European Union.
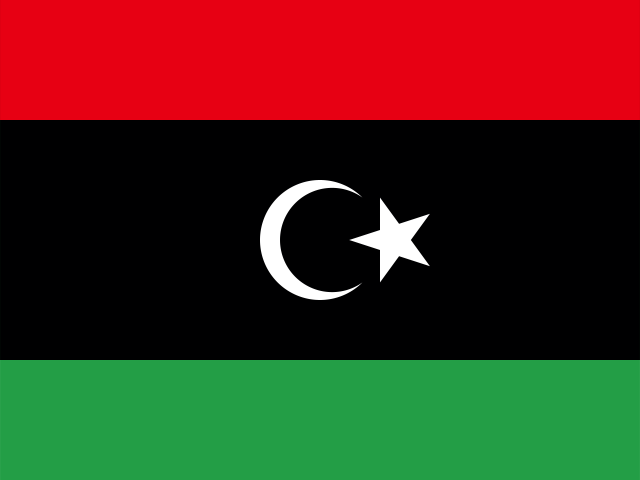
Oil, which makes up nearly all of its exports and government income.
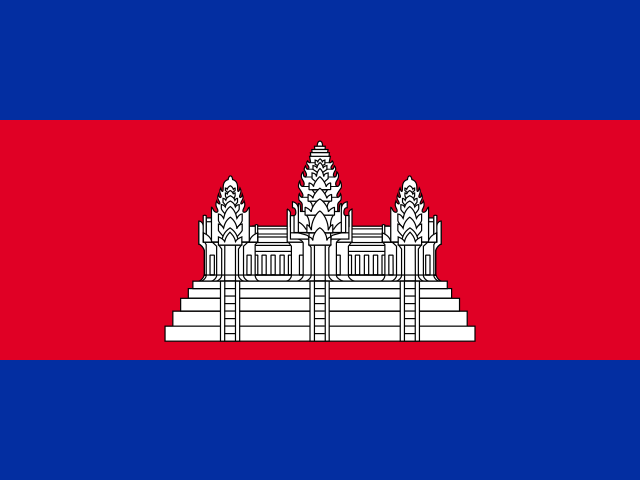
Garment and footwear exports, tourism, construction and agriculture.
Worth knowing
- GDP at market exchange rates measures what an economy is worth in dollars today. Measured by what money buys at home, known as purchasing power parity, China is the largest economy and India is third.
- A big economy is not the same as rich people: Luxembourg, Ireland and Switzerland are far richer per person than countries ranked above them.
- Pakistan and Sri Lanka have no IMF forecast for 2026, so their latest IMF figures are used. Taiwan, Hong Kong, Puerto Rico and Macao are listed because the IMF counts them as separate economies. Cuba and Syria are left out because the IMF has no current figures for them.
- Rankings shift each year with growth, inflation and exchange rates, so this list will change.
Follow-ups
What is the Mittelstand?
The Mittelstand is a German word for the layer of small and medium-sized companies, usually family-owned, that form the true engine of the German economy, sitting below the famous giants like Volkswagen and Siemens and doing far more of the actual work.
The word itself means roughly "middle class" or "middle standing." It refers to a group of stable business enterprises in Germany, Austria and Switzerland that have proved particularly successful in enduring economic change and turbulence. In practical terms, it is usually defined as small and medium-sized enterprises with annual revenues up to €50 million and a maximum of 500 employees, though the category stretches further than that: depending on the specific definition, the Mittelstand Within can range all the way from small craft workshops to hidden champions worth up to a billion euros.
Why it matters to Germany's $5.5 trillion economy
Over 99 percent of German firms are Mittelstand firms. The German Mittelstand not only accounts for the majority of businesses in Germany, numbering more than three million, but also provides some 60 percent of all jobs and over 80 percent of all apprenticeships. And these are not just domestic players: the Mittelstand accounts for 68 percent of Germany's exports, while Germany's larger corporations generate only 32 percent.
The reason Germany punches so far above its weight as an exporter is largely these companies. The German economic model derives its strength not from a small number of dominant players, industries or industrial regions, but from a wide range of companies, small, medium-sized and large, based in locations all across Germany, specializing in all sorts of different sectors, and often forming close networks with one another.
The "hidden champions" inside the Mittelstand
Within the Mittelstand sits a remarkable subset that economists call hidden champions: world market leaders in niche markets, hidden champions are an important part of the German Mittelstand and are heavily associated with the success of the German economy. You have probably never heard of most of them. To qualify, a company must be positioned in the top three of the global market or take the top spot on its continent in terms of market share, its revenue must not exceed $4 billion, and it must have a low level of public awareness. These firms pick one narrow thing, whether it is adhesives, fish food, fire trucks or titanium aerospace castings, become the world's best at it, and sell it everywhere.
The primary focus of these companies is usually on highly customized and specialized products and services, and they can rely on a highly skilled and flexible workforce, supplied by Germany's exceptional vocational training system. That training pipeline is the secret ingredient most other countries have tried and failed to copy: the German economy is unique with its deep, sometimes centuries-old connections between industrialist families, local banks, universities, technical schools and workers.
What makes it hard to export
While some countries, like Britain, have attempted to emulate the Mittelstand model, some have argued that exporting the Mittelstand would require exporting the German views on labor and capital. The resilience is also remarkable: the stability and resilience of Germany in the wake of the subprime mortgage crisis of 2008 and the European sovereign debt crisis was at least partially attributed to the Mittelstand. Companies rooted in a single craft, owned by a family with a 100-year surname on the door, do not pivot to quarterly earnings games the way a publicly traded conglomerate does. That long time horizon is the model, and it is hard to legislate into existence.

Work it out with people who are also paying attention.
Daily posts and a community reading past the headlines together.
Join me on CEEK
Comments